Power BI Template Tutorial
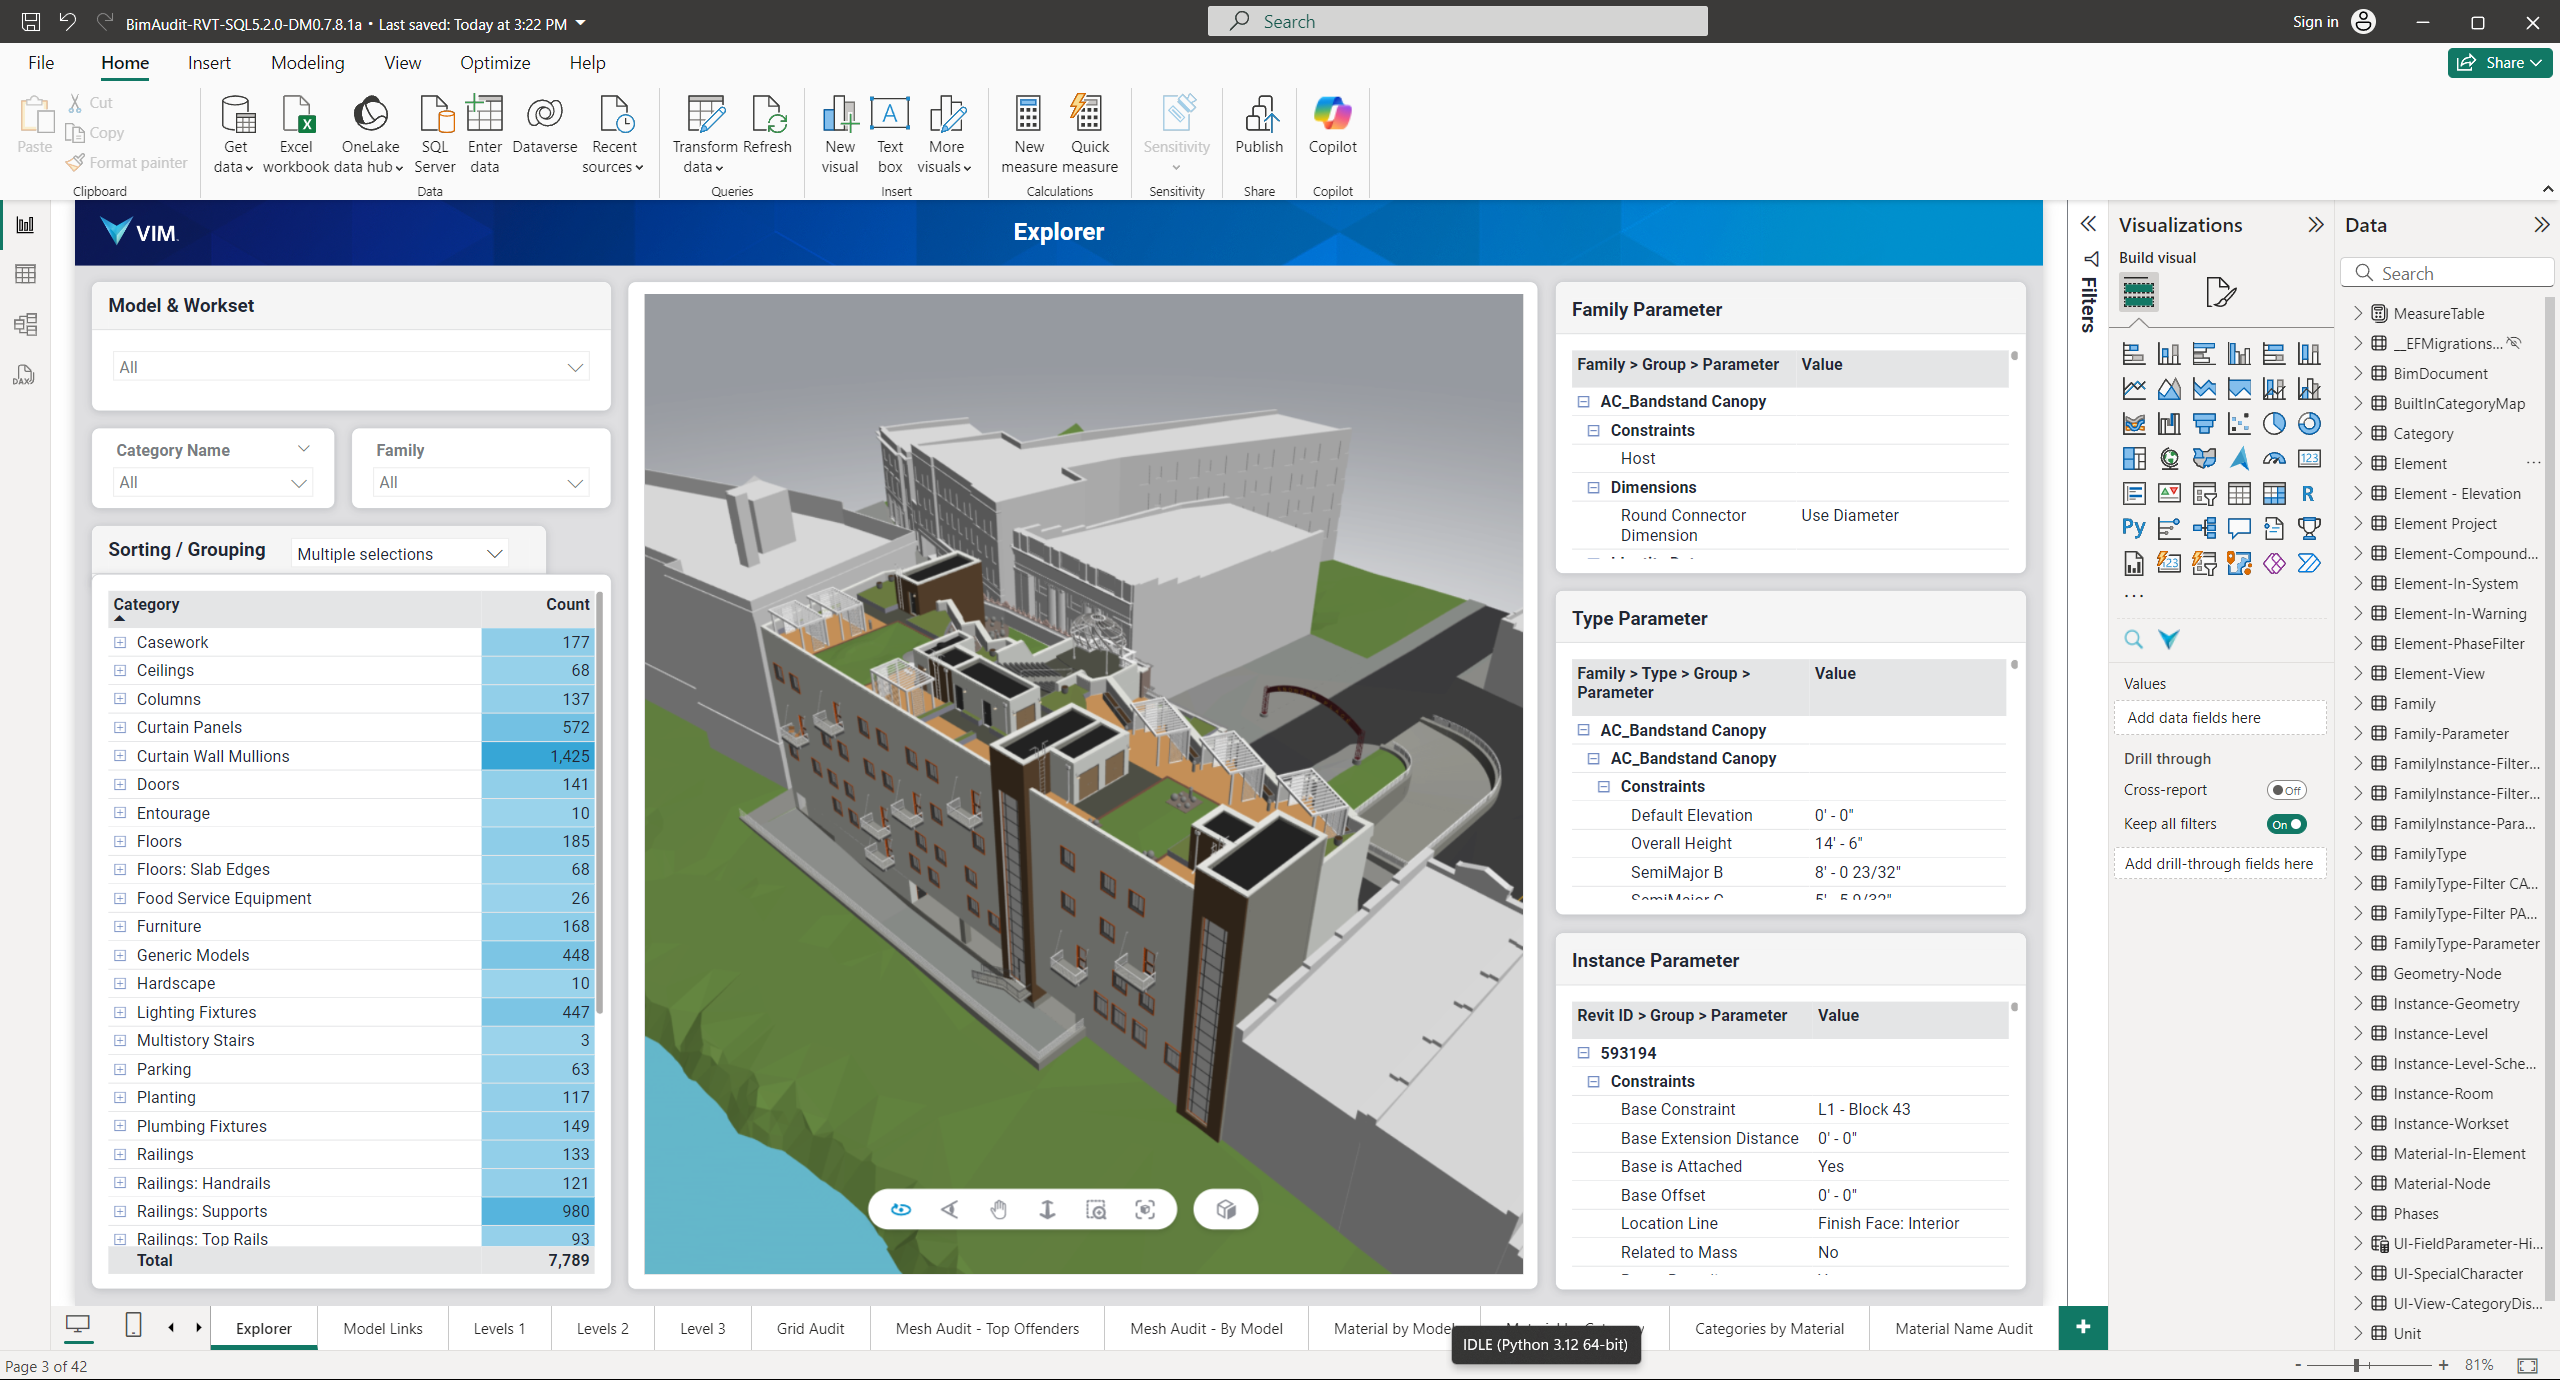
In this tutorial you will re-create the Explorer report (see below) from the sample Power BI template that is included with VIM Enterprise. The Explorer report is designed to show all of the physical elements in a project. For example, you can view elements grouped by category, get counts of individual elements, and view groups of elements or individual elements in the WebGL Viewer.
At any stage during this procedure, you can compare the current state of your report with the existing Explorer report. This will enable you to see how a typical report page is created and explore some of the features and settings in Power BI.
See Power BI Basics for a brief overview of Power BI and the features used to create the Explorer report. For more detailed information on creating reports, refer to the Microsoft Power BI Online Help
Prerequisites
- Install Autodesk Revit 2024
- Install and configure VIM Enterprise
- Download the Snowdon sample project files from Autodesk
- Create a VIM Enterprise project using the Snowdon sample project files
- Configure the sample Power BI template to work with the Snowdon VIM Enterprise project
Step 1: Create and Configure a New Report Page
In this section you will create a new report page, define a custom size for the canvas, add a background image, title, and navigation button. Background images can be used to include a company logo—see the image below, which contains the VIM logo as a banner—or to add style to your report.
To use the sample background image below for this procedure, right-click on the image and choose Save Image As.

Create a New Page
- Click the New page icon (green square with "+") at the bottom right of the Power BI window. The new page is given a default name: Page 1.
- Click-and-drag the new page tab to the left until it is immediately beside the Existing Explorer page. This will make it easier to compare the page your are creating with the existing Explorer page. NOTE: You might have to do this using repeated actions due to a limitation in the current version of Power BI.
- Right-click on the new page tab at the bottom right of the Visualizations panel and choose Rename. Type
Explorer Tutorialand press Enter. The new name appears on the page tab. - On the Visualizations pane, expand Canvas Settings, click on the Type drop-down list and choose Custom. In the Height field, type
1088. In the Width field, type1936. The matrix visual is resized on the canvas. - On the Visualizations pane, expand Canvas background. In the Image field click Browse, choose a jpeg image and click Open. The background image is added to the canvas. NOTE: JPEG images used for the background can include things like a company banner and should match the canvas size in the sample template (in this case, 1088 x 1936). Larger images can be used, but should have an aspect ratio of 16:9. Smaller images or images with different aspect ratios will be stretched or condensed to fit within the canvas, and images and text might be blurred or distorted.
Add a Title
- On the Power BI ribbon, click on Insert. In the Elements section, click Text box. A new text box is added to the matrix visual and the Format text box pane is displayed on the right.
- On the Format text box pane, expand Properties to define the size and position of the visual on the canvas:
- Under Size, set the Height to
64and the Width to448. - Expand Position and set the Horizontal value to
744and the Vertical value to0. - Expand Padding and set the top value to
16.
- Under Size, set the Height to
- On the Format text box pane, turn Title off. Expand Effects and set Background, Visual Border, and Shadow to Off.
- Click inside the text box. Set the Font to Roboto, Calibri, Arial, sans serif and the Font Size to
18. Set the Font Color to White, click Bold, and click the Center alignment option. TypeExplorer. The text is added to the text box using the specified font settings.
Add a Page Filter
- Expand the Filters pane.
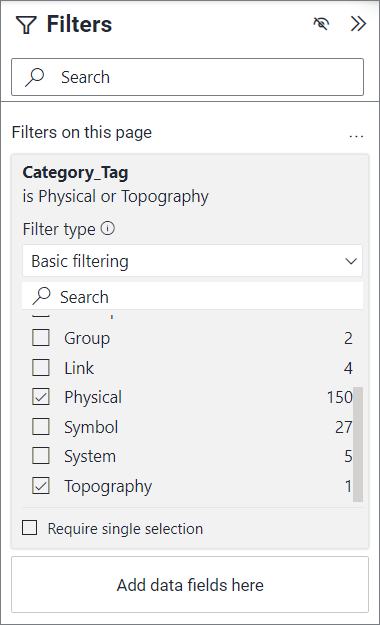
- On the Data pane, expand Category. Click on Category_tag and drag it to the Filters on this page field.
- Under Filter type, enable the Physical and Topography categories. This will limit the display of elements within all visuals on the Explorer page.
Step 2: Add the Element Category Matrix
Elements are the central component of the VIM Data Model and include physical items such as stairs, walls, and floors, but also include non-physical items such as materials, levels, and rooms. Using a matrix, as opposed to a table, enables you to create a tree view displaying the element hierarchy. This particular matrix is central to the Explorer report page and displays a count of all project elements based on the categories selected using the Sorting/Grouping Slicer.
Add Data to the Matrix
- On the Visualizations pane, click the Matrix icon. A new, unformatted matrix visual is added to the canvas. Click on the new matrix visual to select it.
- Assign the following tables from the Data panel to the specified fields on the Visualizations > Build Visual panel:
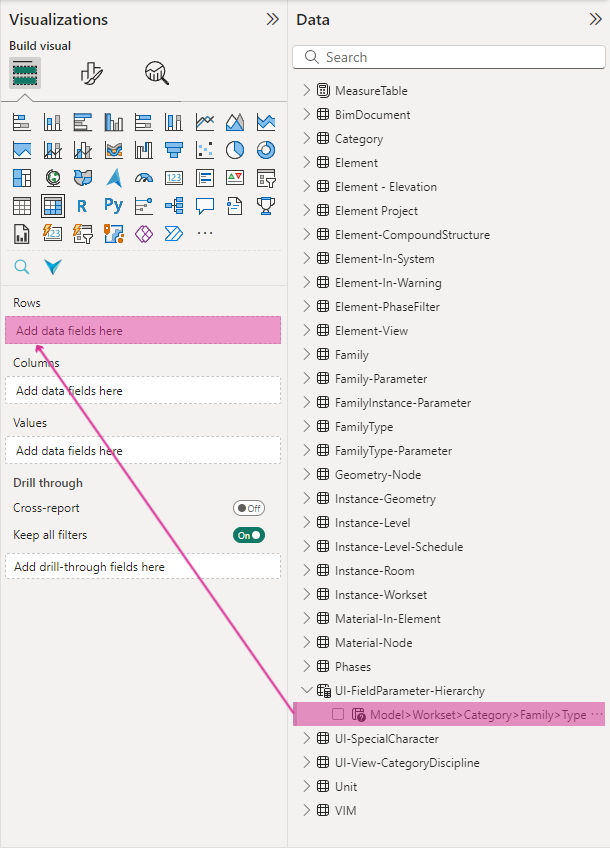
- Expand the UI-FieldParameter-Hierarchy table, click on Model>Workset>Category>Family>Type and drag it to the Rows field (see image above). A Model column (Model is the top element in the hierarchy) is added to the matrix.
- Expand the Element table, click on Element.Index and drag it to the Values field. A Count of Element.Index column is added to the matrix, with a total count of unique elements. On the Visualizations panel, under Values, click the drop-down menu beside Count of Element.Index. Note that Count is selected for the Element.Index table. If, for example, you select Average instead of Count, the value in the matrix would show the average values from the table.
Customize the Display
- At the top of the Visualizations pane, click Format visual.
- On the Build Visual panel, under the Values field, double-click on Count of Element.Index, change the text to
Count, and press Enter. The column header is updated. - On the Visualizations > Format Visual panel, click the Visual tab. Expand Specific column and turn Apply to header on. Expand the Values section, and click the Right alignment option. The Count column header is right-aligned in the matrix visual.
- On the Visual tab, expand Cell Elements, turn Background color on and then click the Conditional formatting (fx) button. Under Minimum, click the color drop-down list and select the lightest shade of blue (#9bd3eb). Under Maximum, click the color drop-down list and select the medium shade of blue (#37a6d6). Click OK. In the matrix visual, the colors in the Count column are updated to show the range of values.
- On the Visualizations > Format Visual panel, click on the General tab to define the size and position of the visual on the canvas:
- Expand Properties. Under Size, set the Height to
704and the Width to528. - Expand Position and set the Horizontal value to
16and the Vertical value to368.
- Expand Properties. Under Size, set the Height to
- On the Format Visual > General panel, turn Title off. The gray line at the top of the matrix is removed.
- On the Format Visual > General panel, expand Data Format. Under Apply Settings To, select Count. Under Format Options, select Whole Number and set the Thousands separator to On. Values over 1000 will be displayed with a comma separator.
- On the ribbon, click on the Format tab. Click Bring Forward and choose Bring To Front. This foregrounds the drilling tools for the Element Category matrix, so they are not hidden behind the slicer created in the procedure below.
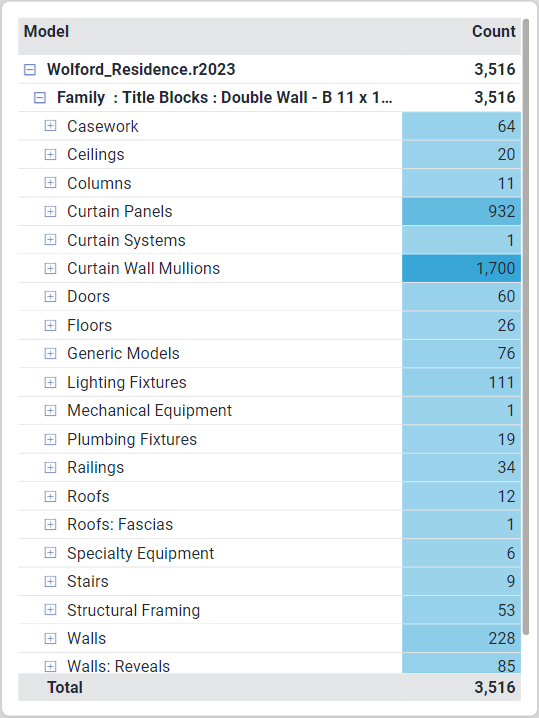
The completed element category matrix should look similar to the image below.
Step 3: Add the Element Category Matrix Sorting/Grouping Slicer
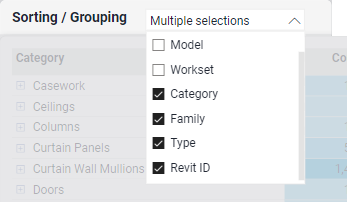
The Sorting/Grouping slicer enables you to define the hierarchical display of categories in the Element Category matrix you created in the previous step. You can select any or all of the following categories: Model, Workset, Category, Family, Type, and Revit ID. On the Explorer report page, the Model and Workset categories are not selected by default.
Add a Text Box
- On the Power BI ribbon, click on the Insert tab and choose Text box.
- On the Format Text Box pane, define the size and position of the Text box on the canvas:
- Expand Properties. Under Size, set the Height to
64and the Width to364. - Expand Position and set the Horizontal value to
16and the Vertical value to320.
- Expand Properties. Under Size, set the Height to
- On the Format Text Box pane, make sure Title is set to On.
- Expand Title and type
Sorting / Groupingin the Text field. - With the Text box still selected, on the ribbon, click on the Format tab. Click Send Backward and choose Send To Back. This places the text box behind the Element Category matrix. The text box appears as a tab above the Element Category matrix and will act as a container for the slicer.
Add the Slicer
- On the Visualizations pane, click the Slicer icon. A new slicer visual is added to the canvas.
- On the Data pane, expand the UI-FieldParameter-Hierarchy table, click on Model>Workset>Category>Family>Type and drag it to the Field box on the Visualizations pane. A checkbox list of element categories is added to the slicer visual.
- With the slicer visual still selected on the canvas, on the Visualizations pane, click Format Your Visual. On the Visual tab, expand Slicer Settings and choose Dropdown from the Style list. The list of categories is changed to a drop-down checkbox list in the slicer visual.
- On the Visual tab, expand Values. Under Background, click the Color drop-down menu and choose White.
- On the Visualizations pane, click on the General panel and turn Title off.
- On the Visualizations pane, click Format Visual, and then click on the General panel to define the size and position of the slicer on the canvas:
- Expand Properties. Under Size, set the Height to
64and the Width to176. - Expand Position and set the Horizontal value to
192and the Vertical value to320.
- Expand Properties. Under Size, set the Height to
- On the General panel, expand Padding type the following values: Top:
5, Bottom, Left, Right:0. - On the General panel, expand Effects and turn Background, Visual Border, and Shadow Off.
- Click the slicer drop-down menu and enable Category, Family, Type, Revit ID. The Element Category table is updated to display the selected hierarchy. Note that the order in which you select the categories from the drop-down list determines the hierarchy displayed in the Element Category matrix. For example, if you select Revit ID first and then select Type, the Revit ID will be at the top of the hierarchy, followed by Type.
- Adjust the column widths in the Element Category matrix to match the Explorer page.
Step 4: Add the WebGL Viewer
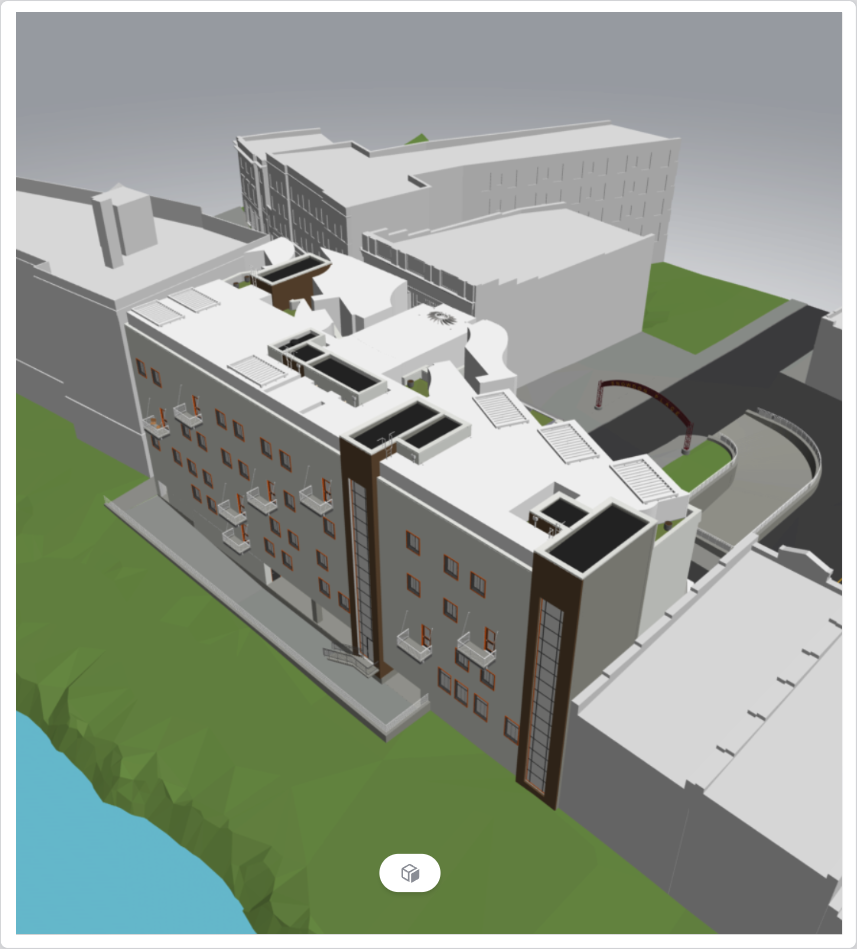
The WebGL Viewer is included with the sample Power BI template as a custom visual and is pre-configured to display 3D mesh data and interact with Power BI visuals such as tables and matrices.
Add Data to the WebGL Viewer
- On the Visualizations pane, on the Build Visual panel, click the VIM Viewer custom visual icon. The WebGL Viewer is added to the Power BI canvas as a custom visual.
- Assign the following tables from the Data panel to the corresponding field on the Visualizations > Build Visual panel:
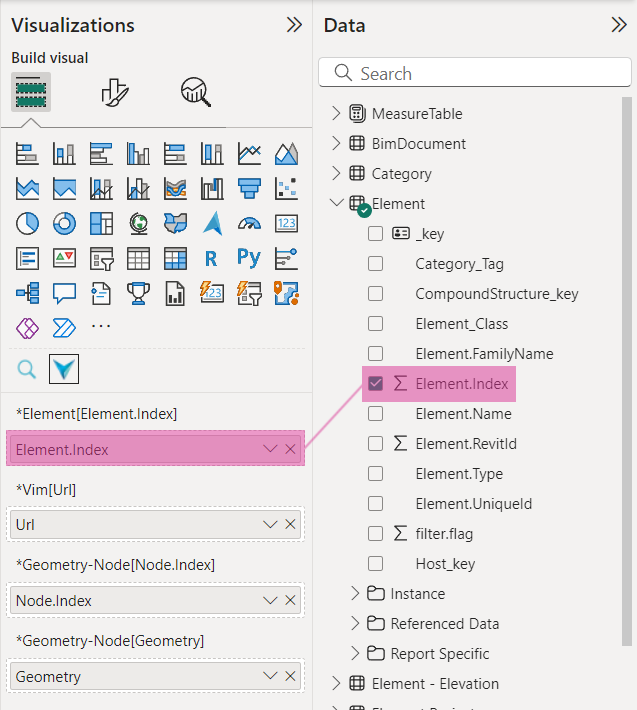
- Expand the Element table, click on Element.Index and drag it to the Element[Element.Index] field (see below).
- Expand the VIM table, click on Url and drag it to the VIM[Url] Field.
- Expand the Geometry-Node table, click on Node.Index and drag it to the Geometry-Node[Node.Index] field.
- In the Geometry-Node table, click on Geometry and drag it to the Geometry-Node[Geometry] field.
Customize the Display
- With the WebGL Viewer still selected on the canvas, on the Visualizations pane, click Format Visual.
- On the Visual panel, expand Viewer and set Can Select to Off. This disables the selection of objects within the viewer.
- Expand UI. Under Panels, make sure only Loading Box is turned On. This displays the progress indicator when loading VIM files from the specified URL.
- Under the Axes, Cursors, and Settings sections, make sure all options are turned Off. Under Tools, make sure only Sectioning Mode is turned On. The Sectioning Mode tool is added near the bottom of the WebGL Viewer.
- On the Visual panel, set Context to On. When set to On, ghost view is enabled when viewing selected objects.
- On the Visual panel, set Outlines to On and select Changed from the Mode drop-down menu. Objects will be outlined in light blue whenever the the set of visible objects has changed in the viewer, for example if an element is selected within a matrix.
- On the General panel, expand Properties. Expand Position and set Horizontal to
544and Vertical to80. Under Size, set the Height to992and the Width to896. - On the General panel, set Title to Off. The title bar is removed from the Viewer
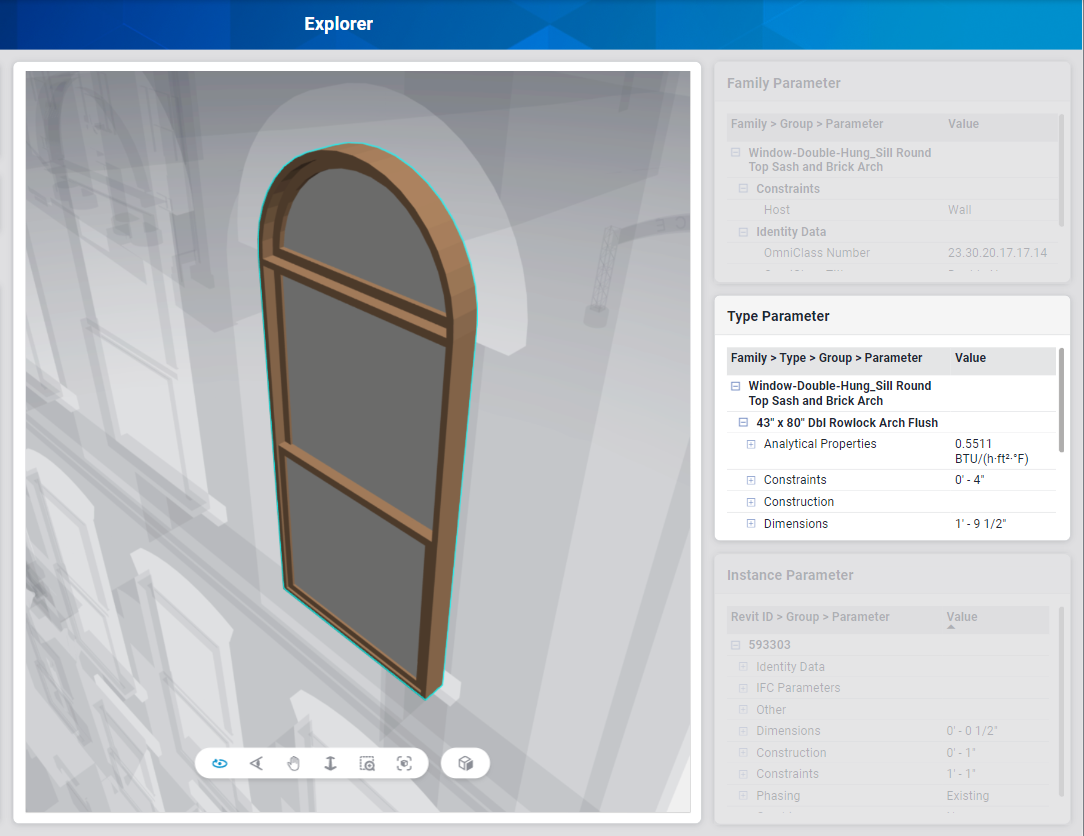
Step 5: Add the Family Parameters Matrix
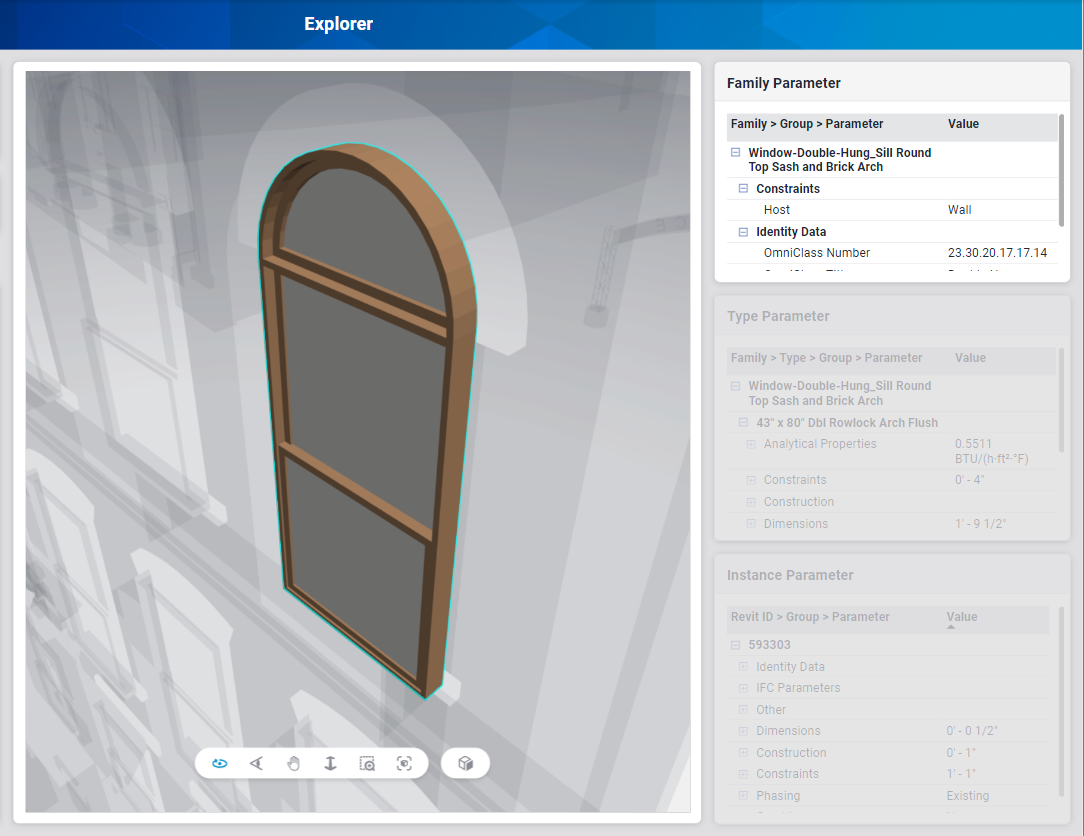
The Family Parameters matrix displays a list of Families categorized by the Group (e.g., Constraints, Identity Data) and then further categorized by the Parameter Name (e.g., Host, Omniclass Number), and then the corresponding Parameter Value.
Add Data to the Matrix
- On the Visualizations pane, click the Matrix icon. A new matrix visual is added to the canvas. Click on the new matrix visual to select it.
- Assign the following tables from the Data panel to the specified fields on the Visualizations > Build Visual panel:
- Expand the Family-Parameter table, click on Parameter_DisplayValue and drag it to the Values field. A new column is added to the matrix and labelled as First Parameter_DisplayValue ("First" is the default sorting method for the data type). No data is displayed at this point because no columns have been added.
- Expand the Element table, click on Element.RevitID and drag it to the Rows field. The Element.RevitID column is added to the matrix visual. The OmniClass Number, where available, is added to the Values column because it is the first value available linked to the Revit ID in the data model.
- Expand the Family-Parameter > Parameter Descriptor table, click on Descriptor_Group and drag it to the Rows field, below Element.RevitID. A second level is added to the matrix visual, displaying the family category groups (e.g., Constraints, Identity Data) and parameter values for each Revit ID.
- Expand the Family-Parameter > Parameter Descriptor table, click on Descriptor_Name and drag it to the Rows field, below Descriptor_Group. A third level is added to the tree view, displaying the family names (e.g., Host, Omniclass Number) and the parameter values.
Customize the Display
- At the top of the Visualizations pane, click Format visual. On the Visual panel, set Row subtotals to Off. Parameter values are removed from the family category rows.
- On the Visualizations pane, click Format Visual, and then click on the General panel to define the size and position of the visual on the canvas:
- Expand Properties. Under Size, set the Height to
288and the Width to463. - Expand Position and set the Horizontal value to
1456and the Vertical value to80.
- Expand Properties. Under Size, set the Height to
- On the Visualizations pane, click Format visual, and then click on the General panel. Expand Title and type
Family Parametersin the Text box. The title is added to the matrix visual. - On the Visualizations pane, click Build visual. Under Rows, double-click on Element.RevitId, change the text to
Family > Group > Parameterand press Enter. The column header is updated in the matrix visual to reflect the hierarchy of the matrix tree view. - On the Build visual panel, under Values, double-click on First Parameter_DisplayValue, change the text to
Valueand press Enter. The column header is updated in the matrix visual. - Manually resize the columns by clicking the right side of a column and dragging to the left or right. You might have to use the bottom scrollbar in the matrix visual to resize the right column.
Step 6: Add the Type Parameters Matrix
Similar to the Family Parameters matrix, the Type Parameters matrix displays a list of Families categorized by Type and then further categorized by the Group, Parameter Name (e.g., Materials and Finishes), and then the corresponding Parameter Value.
Add Data to the Matrix
- On the Visualizations pane, click the Matrix icon. A new matrix visual is added to the canvas. Click on the new matrix visual to select it.
- Assign the following tables from the Data panel to the specified fields on the Visualizations > Build Visual panel:
- Expand the FamilyType-Parameter table, click on Parameter_DisplayValue and drag it to the Values field. A new column is added to the matrix and labelled as First Parameter_DisplayValue ("First" is the default sorting method for the data type). No data is displayed at this point because no columns have been added.
- Expand the Element table, click on Element.RevitID and drag it to the Rows field. The Element.RevitID column is added to the matrix.
- Expand the FamilyType-Parameter > Parameter Descriptor table, click on Descriptor_Group and drag it to the Rows field, below Element.RevitID. A second level is added to the matrix visual, displaying the type categories (e.g., Analytical Properties, Construction).
- Expand the FamilyType-Parameter > Parameter Descriptor table, click on Descriptor_Name and drag it to the Rows field, below Descriptor_Group. A third level is added to the tree view, displaying the type parameter names for each category (e.g., Analytic Construction, Construction Type Id) and the parameter values.
Customize the Display
- On the Visualizations pane, on the Format visual panel, turn off Column subtotals and Row subtotals.
- On the Visualizations pane, click Format Visual, and then click on the General panel to define the size and position of the visual on the canvas:
- Expand Properties. Under Size, set the Height to
320and the Width to463. - Expand Position and set the Horizontal value to
1456and the Vertical value to384.
- Expand Properties. Under Size, set the Height to
- At the top of the Visualizations pane, click Format visual and then click on the General panel. Expand Title and type
Type Parametersin the Text box. The title is added to the matrix visual. - On the Visualizations pane, click Build visual. Under Rows, double-click on Element.RevitId, change the text to
Family > Type > Group > Parameterand press Enter. The column header is updated in the matrix visual to reflect the hierarchy of the matrix tree view. - On the Build visual panel, under Values, double-click on First Parameter_DisplayValue, change the text to
Valueand press Enter. The column header is updated in the matrix. - Manually resize the columns by clicking the right side of a column and dragging to the left or right. You might have to use the bottom scrollbar to resize the right column.
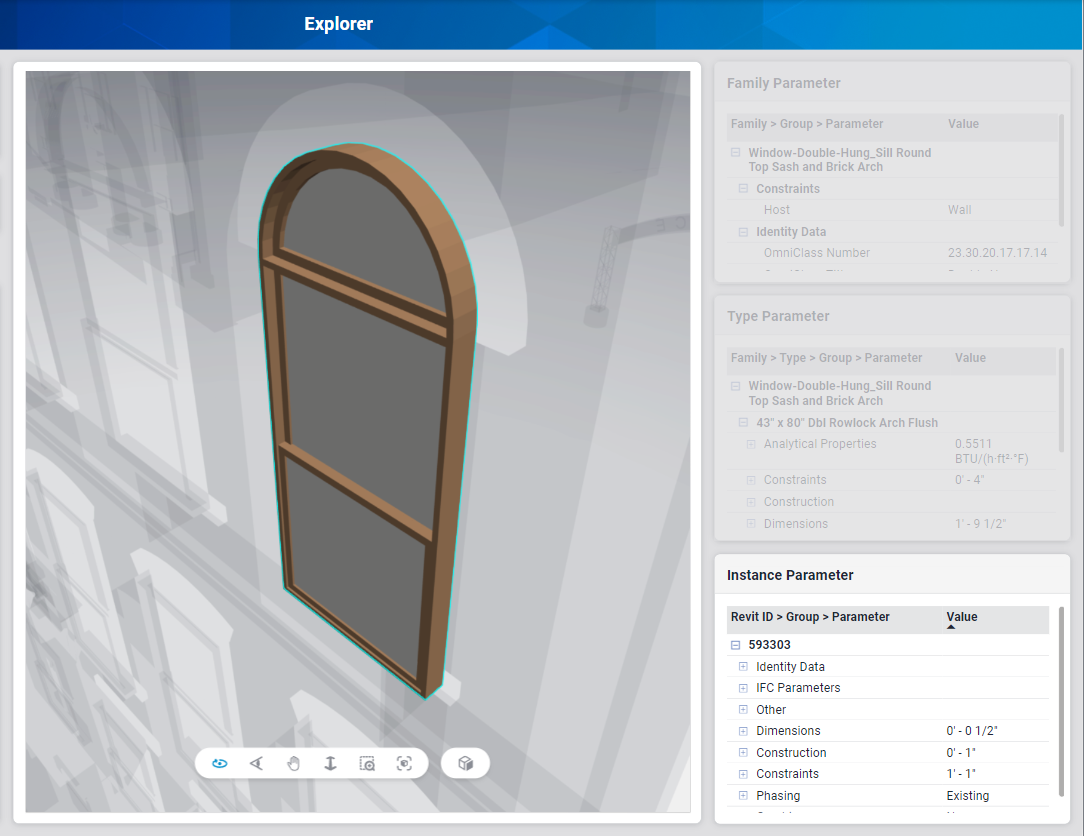
Step 7: Add the Instance Parameters Matrix
Similar to the Type Parameters matrix, the Instance Parameters matrix displays a list of Revit IDs categorized by the Instance (e.g., Dimensions) and then further categorized by the Parameter Name (e.g., Arch Offset from Face), and then the corresponding Parameter Value.
Add Data to the Matrix
- On the Visualizations pane, click the Matrix icon. A new matrix visual is added to the canvas. Click on the new matrix visual to select it.
- Assign the following tables from the Data panel to the specified fields on the Visualizations > Build Visual panel:
- Expand the FamilyInstance-Parameter table, click on Parameter_DisplayValue and drag it to the Values field. A new column is added to the matrix and labelled as First Parameter_DisplayValue ("First" is the default sorting method for the data type). No data is displayed at this point because no columns have been added.
- Expand the Element table, click on Element.RevitID and drag it to the Rows field. The Element.RevitID column is added to the matrix, and values (where available) are added to the other column.
- Expand the FamilyInstance-Parameter > Parameter Descriptor table, click on Descriptor_Group and drag it to the Rows field, below Element.RevitID. A second level is added to the matrix visual, displaying the Instance categories.
- Expand the FamilyInstance-Parameter > Parameter Descriptor table, click on Descriptor_Name and drag it to the Rows field, below Descriptor_Group. A third level is added to the tree view, displaying the instance parameter names for each category (e.g., Identity Data, Other ) and the parameter values.
Customize the Display
- On the Visualizations pane, click Format visual. On the Visual panel, turn off Column subtotals and Row subtotals.
- On the Visualizations pane, click Format Visual, and then click on the General panel to define the size and position of the visual on the canvas:
- Expand Properties. Under Size, set the Height to
352and the Width to463. - Expand Position and set the Horizontal value to
1456and the Vertical value to720.
- Expand Properties. Under Size, set the Height to
- At the top of the Visualizations pane, click Format visual, and then click on the General panel. Expand Title and type
Instance Parametersin the Text box. The column header is updated in the matrix visual to reflect the hierachy of the matrix tree view. - On the Visualizations pane, click Build visual. Under Rows, double-click on Element.RevitId, change the text to
Revit ID > Group > Parameterand press Enter. The column header is updated in the matrix visual. - On the Build visual panel, under Values, double-click on First Parameter_DisplayValue, change the text to
Valueand press Enter. The column header is updated in the matrix visual. - Manually resize the columns by clicking the right side of a column and dragging to the left or right. You might have to use the bottom scrollbar to resize the right column.
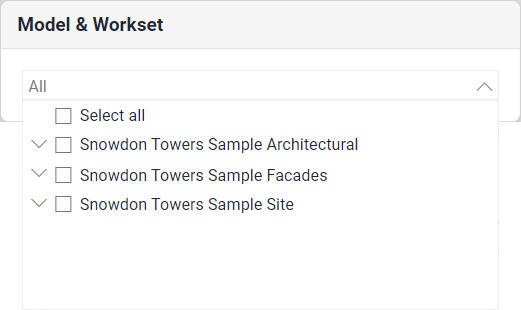
Step 8: Add the Model & Workset Slicer
Slicers provide an easily-accessible method of filtering visuals on a report page based on common or important criteria. The slicers used for the Explorer report page use a simple drop-down list with checkboxes for each option. If no options are selected (the default state), then all options are selected. The Model & Workset slicer enables you to filter the visuals on the report page based on the different Revit project files and worksets used with the sample Snowdon Towers project.
Add Data to the Slicer
- On the Visualizations pane, click the Slicer icon. A new slicer visual is added to the canvas.
- Assign the following tables from the Data panel to the specified fields on the Visualizations > Build Visual panel:
- Expand the Element > FReferenced Data table, click on BimDocument.File_Name and drag it to the Field box. A checkbox list of Revit project files is added to the slicer.
- Expand the Element > Referenced Data table, click on Workset.Name and drag it to the Field box, below File_Name. A second level is added to the slicer, displaying the available worksets. Note that this project only has one workset named Workset1.
Customize the Display
- With the slicer visual still selected on the canvas, on the Visualizations pane, click Format Visual. On the Visual panel, expand Slicer Settings and choose Dropdown from the Style list. The list of project files is changed to a drop-down checkbox list in the slicer visual.
- On the Visualizations pane, click on the General panel and expand Properties. Under Size, set the Height to
128and the Width to512. Expand Position and set the Horizontal value to16and the Vertical value to80. The slicer is resized and repositioned on the canvas. - On the General panel, expand Title and type
Model & Worksetin the Text field.
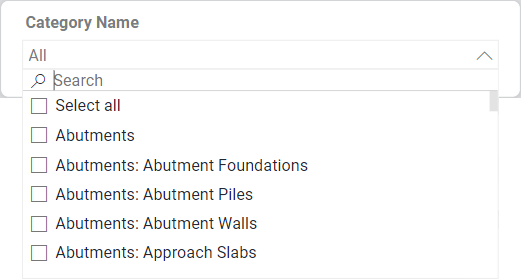
Step 9: Add the Category Name Slicer
The Category Name slicer enables you to filter the visuals on the report page based on Revit Categories, for example, Doors, Walls, and Windows.
Add Data to the Slicer
- On the Visualizations pane, click the Slicer icon. A new slicer visual is added to the canvas.
- On the Data pane, expand the Category table, click on Name_Full and drag it to the Field box on the Visualizations pane. A checkbox list of category names is added to the slicer visual.
Customize the Display
- With the slicer visual still selected on the canvas, click the Format Your Visual button at the top-center of the Visualizations pane. On the Visual panel, expand Slicer Settings and choose Dropdown from the Style list. The list of project files is changed to a drop-down checkbox list in the slicer visual.
- On the Visualizations pane, click on the General panel and turn Title off.
- On the Visualizations pane, click on the General panel and expand Properties. Under Size, set the Height to
80and the Width to240. Expand Position and set the Horizontal value to16and the Vertical value to224. The slicer is resized and repositioned on the canvas. - On the Visual panel, turn on Slicer Header. Expand Slicer Header, and type
Category Namein the Title text field.
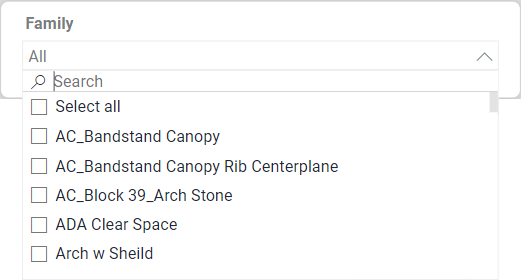
Step 10: Add the Family Slicer
The Family slicer enables you to filter the visuals on the report page based on Revit Families, for example, Floor, Railing, and Shelving.
Add Data to the Slicer
- On the Visualizations pane, click the Slicer icon. A new slicer visual is added to the canvas.
- On the Data pane, expand the Element > Referenced Data table, click on Family.Name and drag it to the Field box on the Visualizations pane. A checkbox list of element family names is added to the slicer visual.
Customize the Display
- With the slicer visual still selected on the canvas, click the Format Your Visual button at the top-center of the Visualizations pane. On the Visual panel, expand Slicer Settings and choose Dropdown from the Style list. The list of project files is changed to a drop-down checkbox list in the slicer visual.
- On the Visualizations pane, click on the General panel and turn Title off.
- On the Visualizations pane, click on the General panel and expand Properties. Under Size, set the Height to
96and the Width to512. Expand Position and set the Horizontal value to16and the Vertical value to328. The slicer is resized and repositioned on the canvas. - On the Visual panel, turn on Slicer Header. Expand Slicer Header, and type
Category Namein the Title text field.
Related Topics
Getting Started with Power BI
Power BI Basics