Introduction
The AEC industry spends billions producing data that rarely reaches the people who need it most. VIM unlocks your BIM data, giving every stakeholder AI-assisted workflows to run in-depth reviews, audits, and comparisons, consistently across every project.
Whether you are an architect validating designs, a contractor standardizing project delivery, or an owner tracking progress, VIM makes your building data consistent, accessible, and actionable.
VIM Flex
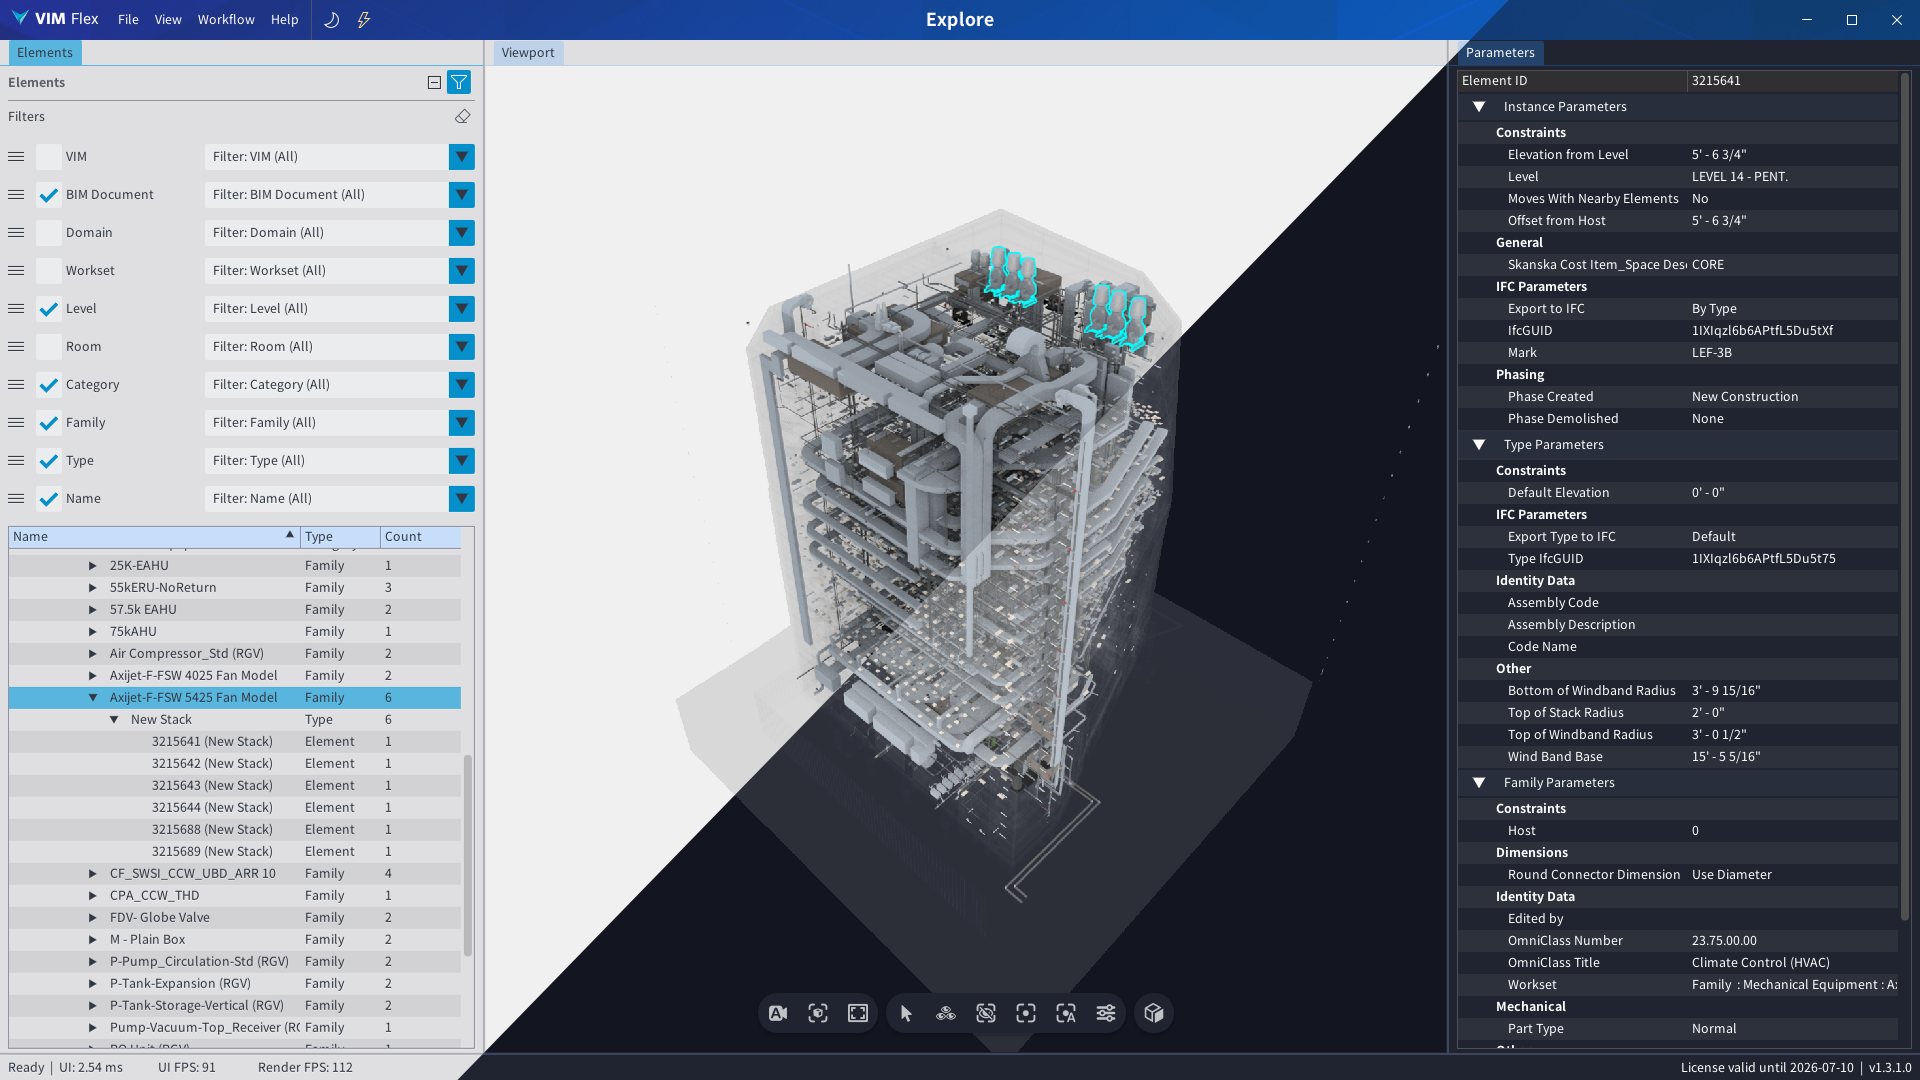
VIM Flex is an AI-ready desktop-based 3D model viewer for Revit, Navisworks, and IFC projects. Export your models as VIM files and open them in VIM Flex to:
- Generate element counts by document, category, workset, level, room, family, and type.
- Audit over-modeled elements that are slowing your team down.
- Compare model revisions to get a clear breakdown of what has been added, removed, or modified.
- Use AI to chat with your building and create customized analysis workflows on demand.
Download VIM Flex or visit the Getting Started guide to begin.
VIM Enterprise & Power BI
VIM Enterprise automates your BIM data pipeline and delivers fully customizable, interactive 3D reports through Microsoft Power BI. With VIM Enterprise, your team can:
- Share fully interactive 3D BIM model reports with teammates and stakeholders on the web.
- Automate compliance checks across naming conventions, parameter values, materials, warnings, worksets, rooms, and level associations.
- Connect your BIM model to other data sources, including ACC, Assemble, and Excel, to build dashboards tailored to your workflow.
All you need is a common key linking your external data to the BIM model like element IDs, parameters, categories, family types, room names, and more.
Contact us about VIM Enterprise to begin your trial, or learn more on our Getting Started page!